Property Description
Available Spaces
Suite E
- Space Available 1,616
- Min. Divisible –
- Max. Contiguous –
- Lease Rate $1.00 sf/m
- Date Available Immediate Occupancy
- Sublease / Expired No / –
- Lease Type:NNN
- Lease Terms:3 – 5 years
- Last Updated:Jun 22, 2017
- Improvement Allowance:negotiable
- CAM:0.36
- Load Factor:–
- Warehouse %:–
- Clearance Height:–
- Heating Description:–
- Power Description:–
- Parking Spaces:–
- # of High Docks:N/A
- # of Grade Docks:–
- Broadband:N/A or Unknown
- Sprinklers:Yes
- Description:Corner unit ready for occupancy
Property Overview
- Per Month $1.00 sf/m
- Per Year $12.00 sf/y
- Zoning C-2
- Parcel Number 176-12-416-001
- T, R, S -, -, –
- Built Yet Yes
- Land SF 50,965.200 sf
- Land Acres 1.170 acres
- Building SF8,000
- # of Buildings 3
- # of Units 7
- # of Stories 1
- Railroad No
- Sprinklers Yes
- Cranes No
Area Description
Fast growing residential community.
Over 200 Single Family Houses being built across the street.
Newer Construction Built in 2006.
Ready for occupancy. Last space remaining!
Easy access to both I-215 and Blue Diamond.
Property Description
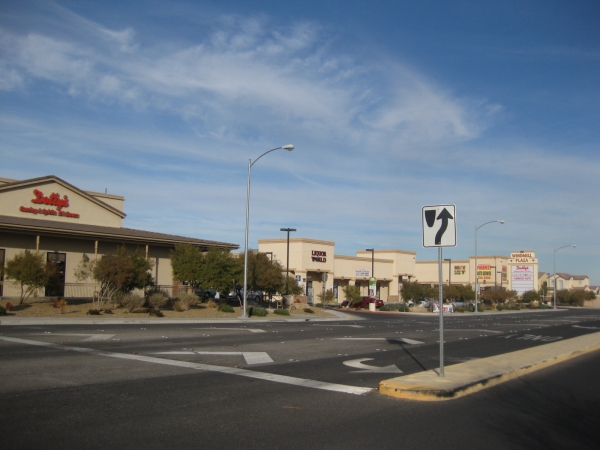
Neighborhood retail center located North East corner of Jones Blvd and Windmill Lane.
Fast growing residential community with over 200 single family houses built across the street from Windmill Plaza.
For qualified tenants first three months lease starting $0.75 per Sq. Ft.
Landlord is offering flexible lease terms and TI concessions to qualified tenants. Call Nora at (702) 217 4921 for further info
Property Features
- Fast growing residential neighborhood
- Over 200 Single Family Houses being built across the street
- Newer Construction Built in 2006
- Ready for occupancy
- Last space remaining
Financial Overview
Per Month : $1.00 sf/m
Per Year : $12.00 sf/y
Property Demographics
| Characteristic | 1 Mile | 3 Miles | 5 Miles |
|---|---|---|---|
| Population (2014) | 25,389 | 68,389 | 265,001 |
| Population male (2014) | 11,934 | 32,545 | 132,225 |
| Population female (2014) | 13,455 | 35,844 | 132,776 |
| % Population male (2014) | 47.0% | 47.6% | 49.9% |
| % Population female (2014) | 53.0% | 52.4% | 50.1% |
| Population age 0-4 (2014) | 1,229 | 3,768 | 15,067 |
| Population age 5-9 (2014) | 1,806 | 4,935 | 18,807 |
| Population age 10-14 (2014) | 1,811 | 4,630 | 17,080 |
| Population age 15-19 (2014) | 1,679 | 4,389 | 15,891 |
| Population age 20-24 (2014) | 1,136 | 3,786 | 14,683 |
| Population age 25-29 (2014) | 767 | 3,175 | 13,836 |
| Population age 30-34 (2014) | 690 | 2,876 | 14,036 |
| Population age 35-39 (2014) | 701 | 2,906 | 15,051 |
| Population age 40-44 (2014) | 731 | 3,206 | 16,346 |
| Population age 45-49 (2014) | 774 | 3,434 | 17,170 |
| Population age 50-54 (2014) | 935 | 3,664 | 17,165 |
| Population age 55-59 (2014) | 1,520 | 4,269 | 17,216 |
| Population age 60-64 (2014) | 2,304 | 5,106 | 17,320 |
| Population age 65-69 (2014) | 2,780 | 5,384 | 16,382 |
| Population age 70-74 (2014) | 2,573 | 4,812 | 13,970 |
| Population age 75-79 (2014) | 1,867 | 3,542 | 10,424 |
| Population age 80-84 (2014) | 1,080 | 2,212 | 6,781 |
| Population age 85+ (2014) | 1,006 | 2,295 | 7,776 |
| % Population age 0-4 (2014) | 4.8% | 5.5% | 5.7% |
| % Population age 5-9 (2014) | 7.1% | 7.2% | 7.1% |
| % Population age 10-14 (2014) | 7.1% | 6.8% | 6.4% |
| % Population age 15-19 (2014) | 6.6% | 6.4% | 6.0% |
| % Population age 20-24 (2014) | 4.5% | 5.5% | 5.5% |
| % Population age 25-29 (2014) | 3.0% | 4.6% | 5.2% |
| % Population age 30-34 (2014) | 2.7% | 4.2% | 5.3% |
| % Population age 35-39 (2014) | 2.8% | 4.2% | 5.7% |
| % Population age 40-44 (2014) | 2.9% | 4.7% | 6.2% |
| % Population age 45-49 (2014) | 3.0% | 5.0% | 6.5% |
| % Population age 50-54 (2014) | 3.7% | 5.4% | 6.5% |
| % Population age 55-59 (2014) | 6.0% | 6.2% | 6.5% |
| % Population age 60-64 (2014) | 9.1% | 7.5% | 6.5% |
| % Population age 65-69 (2014) | 10.9% | 7.9% | 6.2% |
| % Population age 70-74 (2014) | 10.1% | 7.0% | 5.3% |
| % Population age 75-79 (2014) | 7.4% | 5.2% | 3.9% |
| % Population age 80-84 (2014) | 4.3% | 3.2% | 2.6% |
| % Population age 85+ (2014) | 4.0% | 3.4% | 2.9% |
| Population white (2014) | 11,625 | 36,243 | 154,883 |
| Population black (2014) | 2,169 | 5,368 | 21,437 |
| Population Am In/AK Nat (2014) | 40 | 100 | 501 |
| Population Hawaiian/PI (2014) | 126 | 223 | 1,169 |
| Population multirace (2014) | 3,269 | 8,271 | 36,880 |
| Population Hispanic (2014) | 4,111 | 10,995 | 53,530 |
| % Population white (2014) | 45.8% | 53.0% | 58.4% |
| % Population black (2014) | 8.5% | 7.8% | 8.1% |
| % Population Am In/AK Nat (2014) | 0.2% | 0.1% | 0.2% |
| % Population Hawaiian/PI (2014) | 0.5% | 0.3% | 0.4% |
| % Population multirace (2014) | 12.9% | 12.1% | 13.9% |
| % Population Hispanic (2014) | 16.2% | 16.1% | 20.2% |
| Non Hispanic White (2014) | 7,713 | 25,434 | 113,930 |
| % Non Hispanic White (2014) | 30.4% | 37.2% | 43.0% |
| Characteristic | 1 Mile | 3 Miles | 5 Miles |
|---|---|---|---|
| Population (2014) | 25,389 | 68,389 | 265,001 |
| Population (2005) | 10,027 | 25,950 | 148,746 |
| Households (2005) | 3,449 | 9,972 | 58,364 |
| Population 2000 | 2,194 | 12,491 | 96,304 |
| Households 2000 | 763 | 5,050 | 39,283 |
| Population 1990 | 1,930 | 2,601 | 39,387 |
| Households 1990 | 635 | 879 | 16,095 |
| Population Change 2005-2014 | 15,362 | 42,439 | 116,255 |
| % Population Change 2005-2014 | 60.5% | 62.1% | 43.9% |
| Population Change 2000-2005 | 7,833 | 13,459 | 52,442 |
| Household Change 2000-2005 | 2,686 | 4,922 | 19,081 |
| % Population Change 2000-2005 | 78.1% | 51.9% | 35.3% |
| % Household Change 2000-2005 | 77.9% | 49.4% | 32.7% |
| Population Change 1990-2005 | 8,097 | 23,349 | 109,359 |
| Household Change 1990-2005 | 2,814 | 9,093 | 42,269 |
| % Population Change 1990-2005 | 80.8% | 90.0% | 73.5% |
| % Household Change 1990-2005 | 81.6% | 91.2% | 72.4% |
| Total Establishments (2005) | 216 | 513 | 6,435 |
| Total Employees (2005) | 2,757 | 4,866 | 110,481 |
| Characteristic | 1 Mile | 3 Miles | 5 Miles |
|---|---|---|---|
| Housing Units (2014) | 9,545 | 28,690 | 123,933 |
| Owner Occupied Housing Units (2014) | 4,631 | 14,614 | 56,691 |
| Renter Occupied Housing Units (2014) | 3,690 | 9,134 | 45,363 |
| Vacant Housing Units (2014) | 1,224 | 4,942 | 21,879 |
| Occupied Housing Units (2014) | 8,321 | 23,748 | 102,054 |
| Characteristic | 1 Mile | 3 Miles | 5 Miles |
|---|---|---|---|
| Median Household Income (2014) | $76,291.00 | $76,322.00 | $70,976.00 |
| Household Income < $10000 (2014) | 271 | 924 | 3,858 |
| Household Income $10000-$14999 (2014) | 158 | 503 | 2,462 |
| Household Income $15000-$19999 (2014) | 228 | 515 | 3,080 |
| Household Income $20000-$24999 (2014) | 137 | 686 | 3,880 |
| Household Income $25000-$29999 (2014) | 191 | 705 | 4,400 |
| Household Income $30000-$34999 (2014) | 199 | 906 | 4,943 |
| Household Income $35000-$39999 (2014) | 606 | 1,503 | 5,408 |
| Household Income $40000-$44999 (2014) | 271 | 924 | 3,858 |
| Household Income $45000-$49999 (2014) | 403 | 1,051 | 4,461 |
| Household Income $60000-$74999 (2014) | 1,432 | 3,543 | 13,987 |
| Household Income $75000-$99999 (2014) | 1,566 | 4,349 | 17,605 |
| Household Income $100000-$124999 (2014) | 1,283 | 3,115 | 10,406 |
| Household Income $125000-$149999 (2014) | 447 | 1,359 | 5,107 |
| Household Income $150000-$199999 (2014) | 563 | 1,562 | 5,586 |
| Household Income > $200000 (2014) | 182 | 1,042 | 3,853 |


